
20260903
The Billion Dollar Rush: What Location Data Revealed Before the $1.04bn Powerball Draw
GeoLocs Team
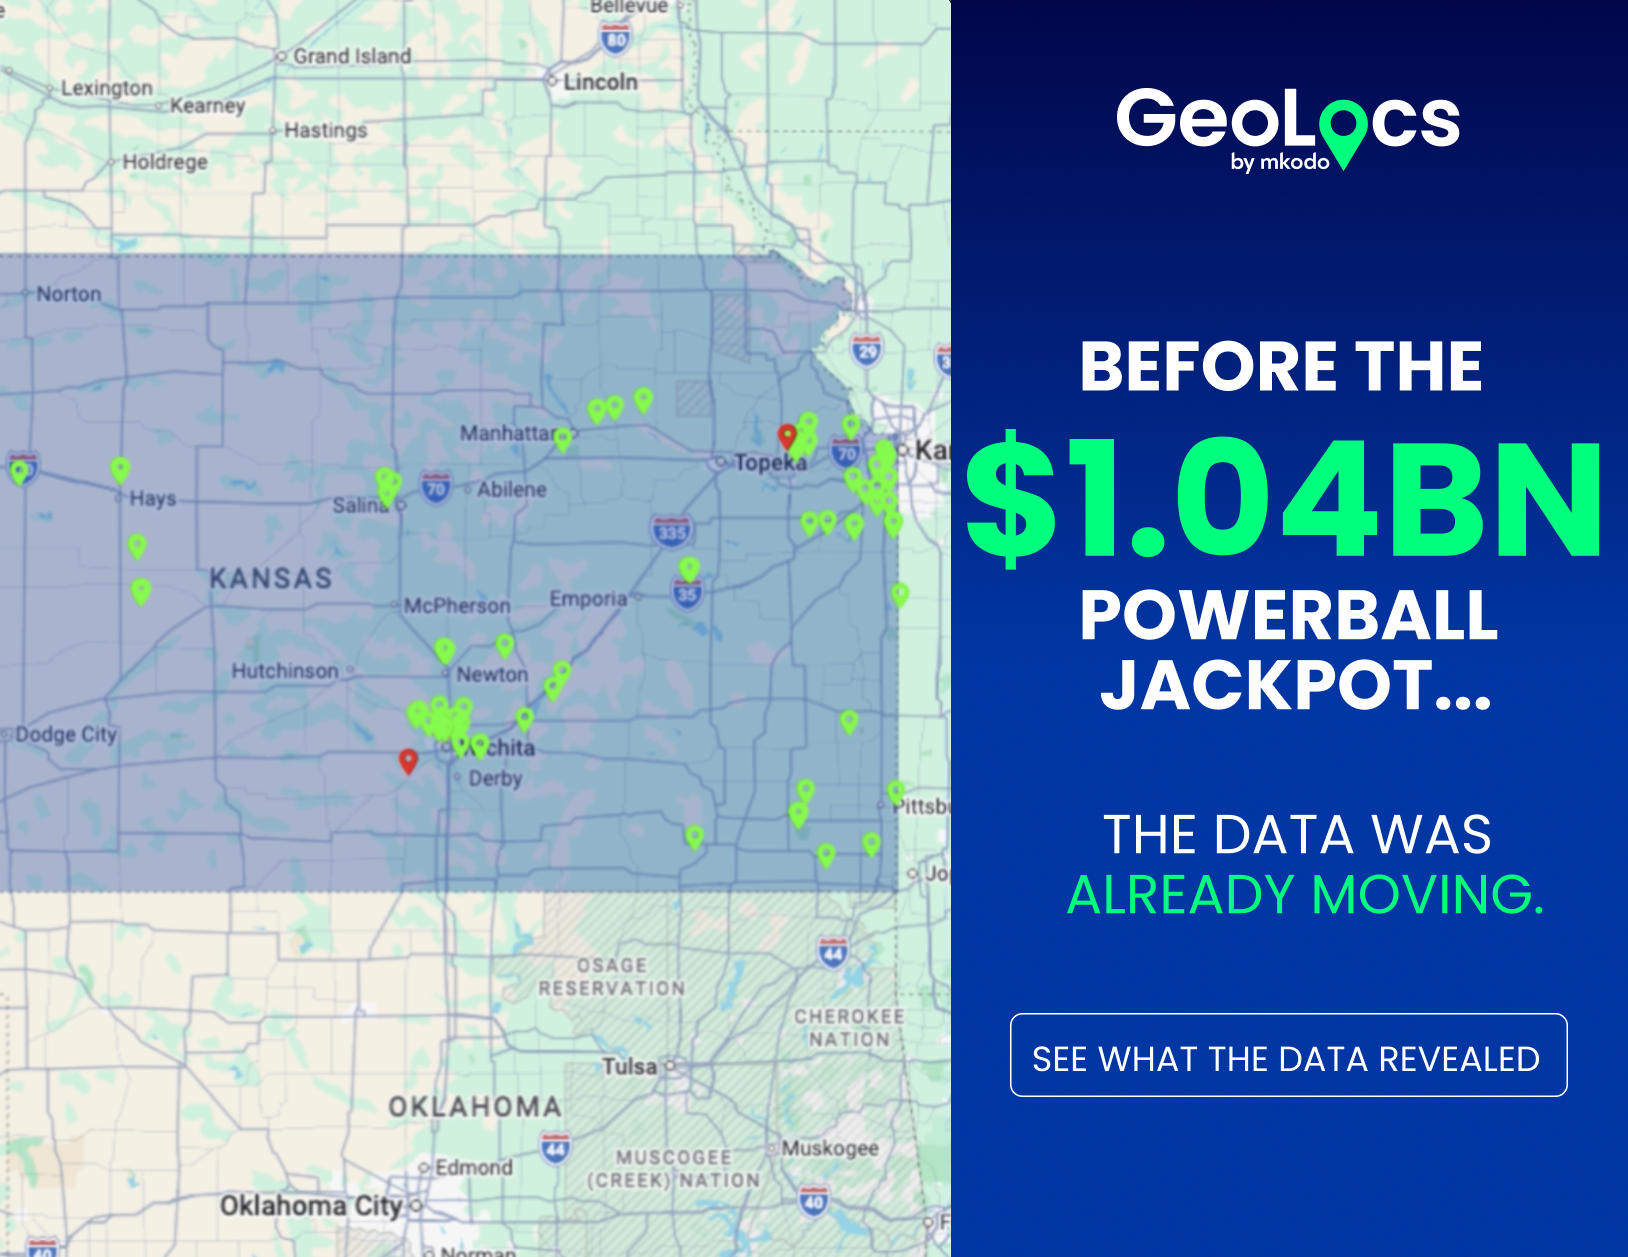
Ahead of the 12th August 2026 Powerball draw, GeoLocs data showed a significant increase in location traffic across Kansas as excitement built around the $1.04 billion jackpot. Although the winning ticket was ultimately sold in Illinois, Kansans were clearly paying attention.
It wasn’t simply the volume that caught our attention, but when that activity was happening. Across Kansas, traffic began moving above its typical level at approximately 17:00, eventually reaching its peak at 21:45. At its peak, activity was 148% above average, before returning towards typical levels following the draw.
Location data alone cannot tell us that every increase was directly caused by Powerball activity. However, the timing creates an interesting pattern and highlights something operators can easily miss when looking at overall performance: an average day can contain some very unaverage moments.
When average traffic doesn’t tell the whole story
Powerball drawings take place at 10:59pm ET, with ticket sales closing earlier depending on the jurisdiction. As a jackpot grows and public attention increases, those final hours can become particularly important.
For operators, looking at total location checks across 24 hours only tells part of the story. If a significant proportion of requests arrive within a much shorter window, the demands placed on the technology are very different. An operator might comfortably process one million checks across a day, but what happens if 200,000 arrive within an hour? Or if a normal minute sees 500 requests and a major event suddenly sends 2,000? The daily total might look perfectly manageable, however the peak tells a different story. That’s why peak to average demand is an important metric to understand. The pattern we observed around the $1.04 billion Powerball draw suggests major jackpots may not simply generate more activity; they can potentially change when that activity happens, concentrating demand around moments of particularly high player intent and that has implications beyond infrastructure.
A player arriving shortly before a major draw may have just seen the jackpot, realised how little time remains and decided to participate. At that point, a slow response, unclear location permission or repeated verification attempt creates friction at arguably the worst possible moment. The question for operators therefore isn’t simply, “Can our technology handle the volume?” It’s also: “Can legitimate players still move through the journey effectively when demand peaks?”
Understanding that means looking beyond total checks. Peak requests per minute, verification success, repeat attempts, response times and failure reasons can provide a much richer picture. Breaking performance down across web, iOS and Android can reveal whether friction is concentrated within a particular channel or journey.
One spike is interesting. A pattern is intelligence.
Perhaps the most useful thing about the 12th August spike is what happens when we compare it with the next one. When another Powerball or Mega Millions jackpot reaches a significant threshold, does traffic behave similarly? Does activity start increasing at the same point? Does a larger jackpot create a sharper spike? Do players behave differently across devices? Then there are events outside lottery, a major sporting final could create a completely different demand curve. Thanksgiving and other major travel periods could show what happens as players move between locations, Wi-Fi networks and jurisdictions. Market launches can reveal how demand develops during the earliest days of regulated play.
One event gives us a data point, tracking these moments over time begins to create a picture of player behaviour. That is where geolocation starts becoming geo-intelligence. The fundamental role of geolocation remains establishing whether a player is somewhere they are permitted to play. However, aggregated and anonymised location activity can potentially tell operators much more: when demand builds, how quickly behaviour changes, which channels players favour and where friction begins to appear.
We won’t draw sweeping conclusions from one Powerball spike, instead, we’ll keep watching. Over the coming months, GeoLocs will be analysing more of these moments across lottery, gaming, major sporting events and periods of unusually high activity to see what the data can teach us. Because sometimes the interesting part isn’t simply how many players arrive. It’s what happens when they all decide to arrive at once.